Last modified: March 20, 2026
Have you ever wondered what’s actually going on when you look up a disc in the flight charts tool at The Ace Holes? Why does one disc curve right and then cut hard to the left at the end, while another flies straight and flat?
The answer lies in physics, math, and a bit of creative programming. In this article we explain exactly how we built the model that calculates flight paths for more than 1,700 discs from over 200 manufacturers.

Table of contents
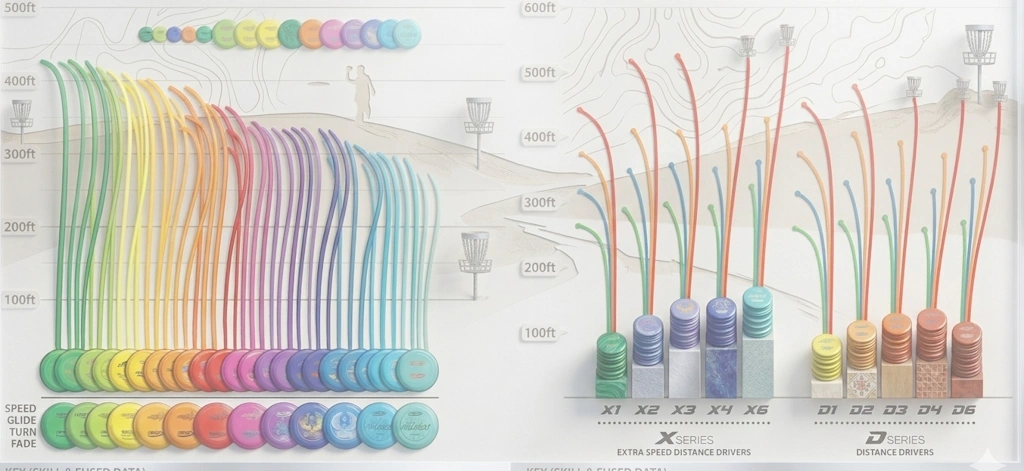
The four flight numbers, and what they actually mean
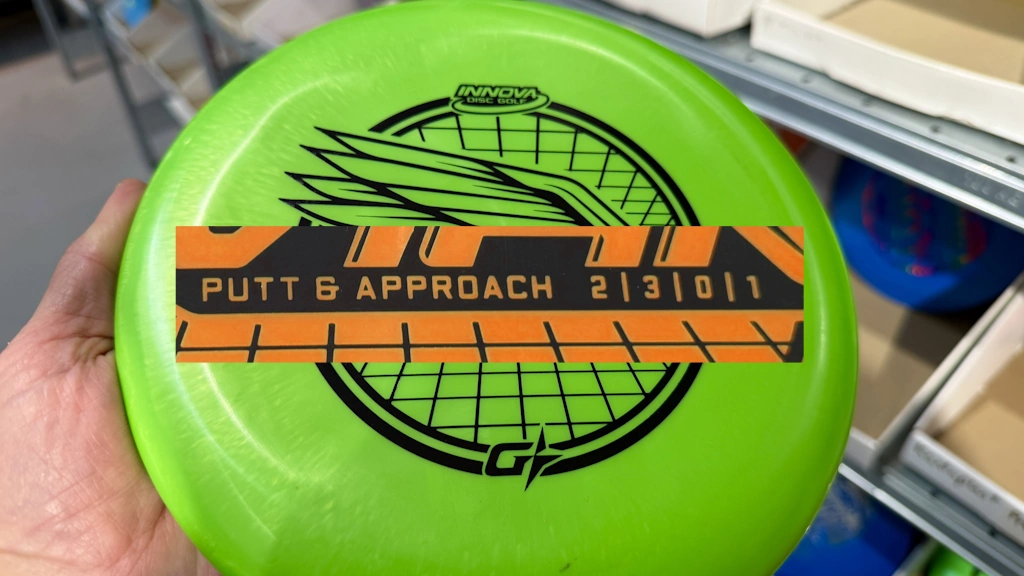
The flight rating system was introduced by Innova in the early 2000s and has since become the standard across the entire disc golf world. You’ll find the numbers on almost every disc: Speed, Glide, Turn, and Fade. But what do they actually mean in practice?
Speed (1–15) is about aerodynamic efficiency, or more precisely, how wide and sharp the rim of the disc is. A wide rim cuts through the air more easily but requires a higher release velocity to behave as intended. A disc rated Speed 12 isn’t just “faster” than one rated Speed 4, it actually requires you to throw harder for it to fly the way the numbers suggest.
Glide (1–7) describes the ratio between lift and drag. High Glide means the disc stays in the air longer, which translates to more distance. It doesn’t mean the disc curves more, it simply glides farther before gravity wins.
Turn (+1 to –5) describes what happens during the first, high-speed phase of the flight. A negative Turn value means the disc will bank to the right for a right-handed backhand (RHBH) thrower. The more negative, the more understable, and the harder it turns right. A value of +1 means the disc actively resists that banking.
Fade (0–5) describes the finish. As the disc loses speed toward the end of its flight, all discs will hook to the left for an RHBH thrower. That’s basic physics. The Fade value tells you how aggressively that hook happens. Fade 0 is almost no hook at all, Fade 5 is a hard, predictable finish to the left.
The physics behind the classic S-curve
The typical S-shape you see from many discs, straight out, curving right, then hooking left at the end, is caused by a phenomenon called gyroscopic precession. This isn’t the Magnus effect (which matters for things like soccer balls), but the same physics that keeps a spinning top from falling over even when gravity is pulling at it.
When a disc is thrown with backspin it spins clockwise when viewed from above. Air pressure creates a force that tries to tip the nose of the disc upward. But because the disc is spinning, that force gets redirected into a sideways roll, and for an RHBH thrower that means the disc banks to the right. This is the Turn phase.
As the disc slows down, its gyroscopic resistance weakens. When the speed drops below a certain threshold, aerodynamic forces take over completely and pull the disc into a leftward hook. That’s the Fade phase. Research by Potts and Crowther (2007) shows that significant lateral drift doesn’t really kick in until the disc’s forward speed drops to roughly 40 percent of its rotational speed at the rim.
How throwing power affects the flight
The flight numbers are calibrated for a specific release velocity. If you throw slower than the disc is designed for, the Turn will never fully activate and the disc will fly more overstable than its numbers suggest. Throw faster, and the disc will curve more, with a softer finish at the end.
In our flight diagram tool you can adjust throwing power with three settings: Slower, Normal, and Faster. These shift the effective Turn and Fade values and scale the estimated distance by 73, 100, and 132 percent of the baseline respectively. The Turn adjustment is asymmetric, meaning that throwing too fast affects Turn more than throwing too slow affects Fade, which lines up with the underlying gyroscopic physics.
How we estimate distance in the flight charts
The estimated distance in the flight diagram tool is calculated like this: Speed multiplied by 5.2, plus Glide multiplied by 5.8, plus a baseline of 38 meters, all scaled by your throwing power setting.
The Speed contribution reflects aerodynamic efficiency: a disc with low drag loses velocity more slowly and travels farther. The Glide contribution reflects lift: a disc that stays aloft well spends more time in the air for every unit of drag it experiences. The 38-meter baseline is the minimum distance a reasonable throw will produce regardless of the disc’s ratings.
As calibration reference points: an Innova Aviar (Speed 2, Glide 3, Turn 0, Fade 1) comes out to around 58 meters, a Discraft Buzzz (5/4/–1/1) to about 87 meters, and an Innova Destroyer (12/5/–1/3) to roughly 128 meters. These numbers line up well with what most amateur players experience on the course.

Bézier curves and the shape of the flight path
The actual flight path is drawn as a cubic Bézier curve with four control points. The starting point is always the release point. From there, one point controls the peak of the rightward Turn phase, another initiates the Fade hook, and the final point is where the disc lands.
The lateral displacement during the Turn phase works out to roughly 9.5 percent of total flight distance per Turn unit, adjusted for the Glide value. Higher Glide amplifies the Turn displacement because the disc spends more time at high speed. The Fade hook pulls the disc to the left from the Turn peak, with a somewhat weaker Glide contribution since the disc is already decelerating by that point.
A disc with Turn –2 and Fade 2 lands almost exactly where you’d expect from a straight throw, the classic S-shot that returns to center. A disc with Turn 0 and Fade 4 flies straight and then cuts hard left. A disc with Turn –4 and Fade 1 sweeps far right and finishes only slightly left of center. All of this is calculated mathematically and drawn in your browser in real time, with no server involved.
What the model can’t capture
It’s worth being clear about what our flight diagram model is, and what it isn’t. It’s a simplified, physics-informed model, not a full three-dimensional simulation. A few limitations are worth knowing about.
Flight numbers are not standardized across manufacturers. A Turn of –2 from one brand is not necessarily the same as –2 from another. The model treats all numbers at face value.
Wind, elevation, and disc weight are not accounted for. Wind has a dramatic effect on high-Glide discs in particular. Higher elevation means thinner air, which reduces both lift and drag. Heavier discs are more wind-resistant and fly slightly more overstable, while lighter discs turn more easily and glide farther.
Read more: Find the right disc in seconds
Disc wear isn’t modeled either. Discs that get thrown a lot gradually change shape and become more understable over time. Premium plastics hold their original flight characteristics longer than baseline blends.
And finally, the diagrams show the flight from a bird’s-eye view, a two-dimensional top-down projection. The vertical arc of the flight isn’t represented, but for shot planning purposes the horizontal view is almost always what matters most.
An open and documented methodology
Several flight diagram tools exist in the disc golf community. Innova has static hand-drawn images. DG Puttheads and Marshall Street both offer interactive tools, but neither has published its underlying methodology. Our model is fully documented, every parameter is derived from a stated physical principle, and the calibration reference points are spelled out explicitly. The source code for the flight diagram tool is annotated so that anyone who’s curious can see exactly how the calculations work.
That means the model can be improved as new aerodynamic research becomes available, and it means you as a user can evaluate the assumptions it’s built on.
The flight diagram tool is available from the menu under “Guides”. There you can look up almost any disc, adjust your throwing power, and compare flight paths side by side.
Want to go deeper?
If you’re curious about the full mathematical details behind the model, we’ve published a complete methodology document that covers everything from the aerodynamic formulas and rigid-body dynamics research the model is based on, to the exact calibration process and every parameter used in the calculations. It’s written for anyone with an interest in the physics, whether you’re a disc golfer who wants to understand what’s happening when your disc flies, or someone with a background in aerodynamics or programming who wants to dig into the numbers.